Building on my previous guide, this blog post dives into setting up debugging for Ionic mobile apps on macOS, with a particular focus on iOS debugging using Visual Studio Code. I’ll walk you through the steps to configure breakpoints, leverage Safari’s Web Inspector, and run your app on both simulators and iPhones for a streamlined development experience.
Debug an Ionic App on iOS Device (from Mac)
In the steps below, I’ll walk you through the process of setting up a debugging environment for your Ionic app on macOS, using Visual Studio Code, Xcode, and Safari’s Web Inspector. You’ll learn how to build the app, connect it to an iOS simulator or physical device, and place breakpoints within your code to catch and resolve issues. By the end, you’ll have a reliable workflow for debugging your app on iPhones or simulators, ensuring a smoother development and testing experience.
1. Open the project in VS Code
Open the Ionic project (e.g., ThPokemonDemo) in Visual Studio Code.
2. Build the project
Run the following command to build your Ionic app using the Ionic CLI.
ionic build3. Sync Capacitor and Open Xcode
Next, sync Capacitor and open the project using the following command (Reference link):
npx cap copy && npx cap sync && npx cap open iosNOTE: npx cap open ios will open the project on XCode.
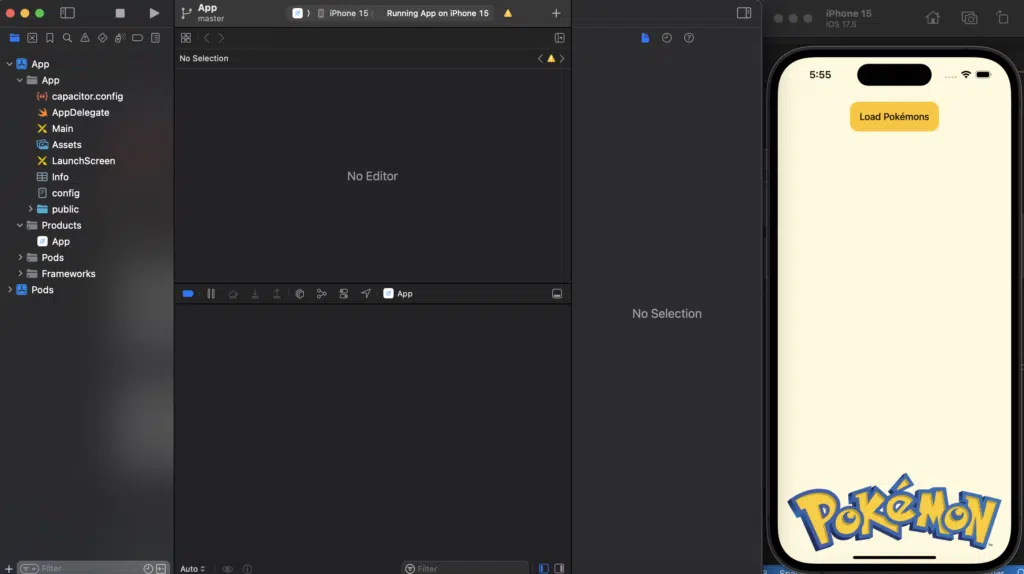
4. Run the app on a simulator or device
In Xcode, select an available simulator or connected iOS device, and run the app.
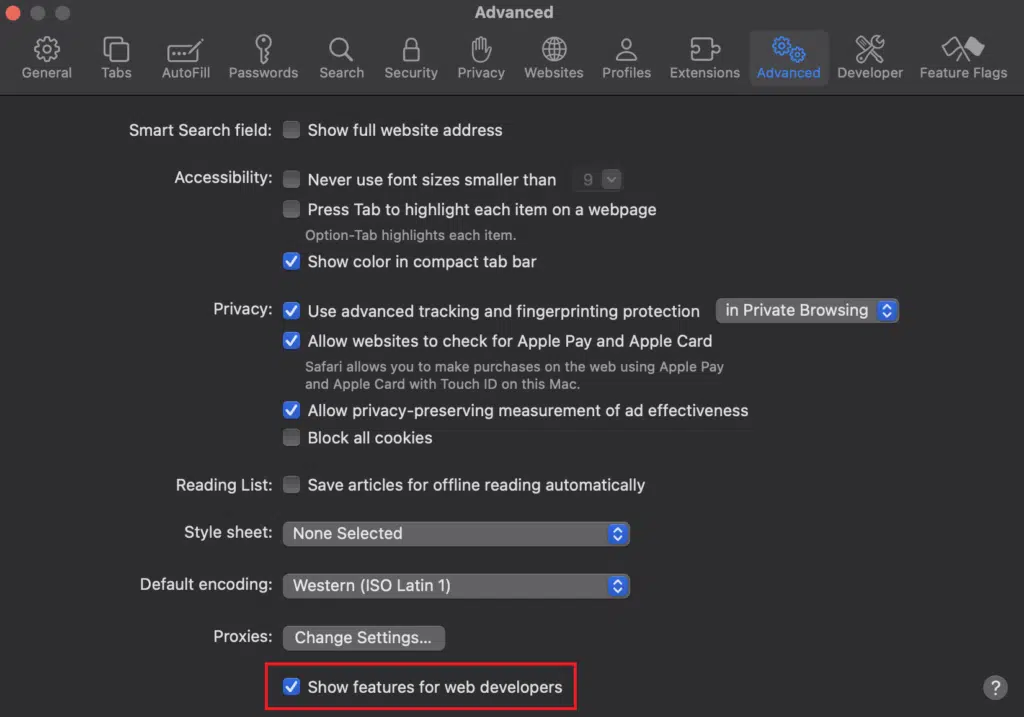
5. Enable Web Inspector in Safari
Open Safari and go Settings > Advanced. Make Sure to enable the “Show features for web developers” option.
6. Connect to your device in Safari
Go to the Develop tab. Select the device where the app is running. Tap your app name (e.g., ThDemo) to open the Web Inspector.

7. Set breakpoints in Safari
Safari will show the following screen where we can put breakpoints to debug the code.
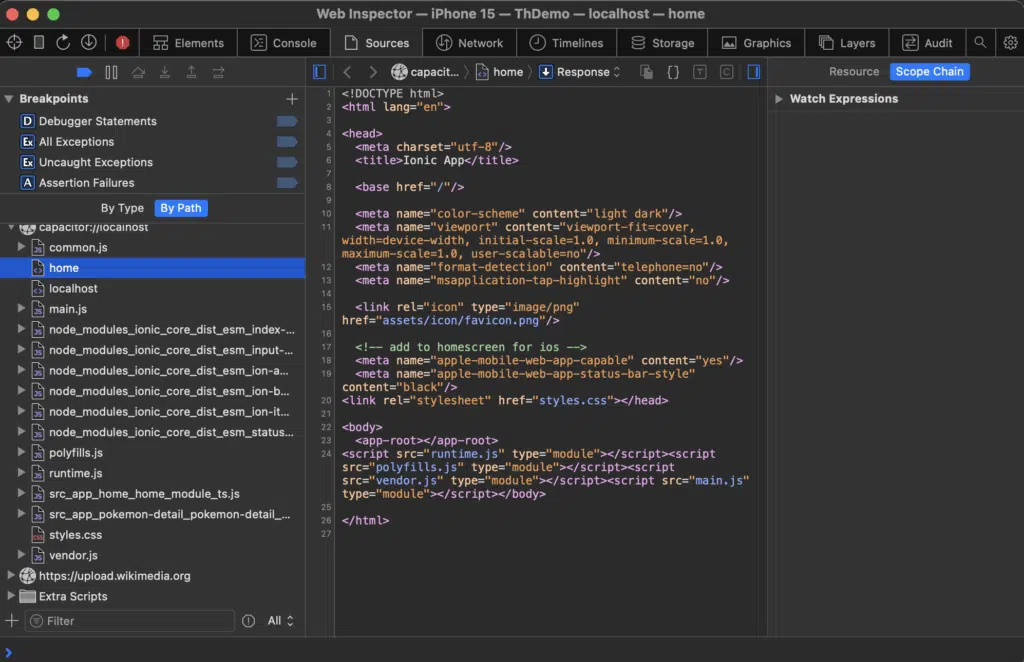
We can see the home.page.ts is under src_app_home_home_module_ts.js.

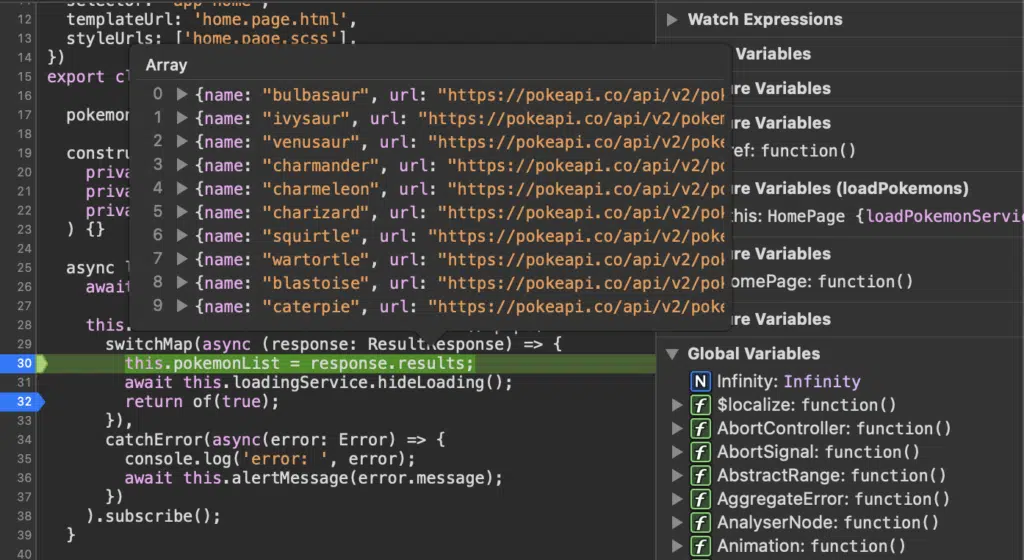
8. Trigger the breakpoints
Let’s put some breakpoints in home.page.ts (Lines 30 and 32) and click Load Pokémons button.

We’ll see the values of results :)!
9. Debug additional pages
Let’s put another breakpoint in pokemon-detal.page.ts (Line 42).

10. Debug on an iPhone
If we want to debug on an iPhone. Select the iPhone on XCode like in step 4 and run the project.
11. Enable Web Inspector on the device
Enable Web Inspector (Settings > Safari > Advanced > Web Inspector).

12. Select the device
Select the iPhone and follow the steps 8 and 9.

Conclusion
By strengthening your debugging setup to support iOS devices and simulators on macOS, you enhance your ability to build reliable Ionic mobile apps. Leveraging VS Code alongside Xcode and Safari’s Web Inspector enables you to confidently address issues on iPhones and ensures a smoother development process, allowing you to deliver a more polished, stable apps.
At Trailhead, we are experts in building and debugging mobile applications using hybrid frameworks like Ionic. If you’d like to learn more, contact us to set up a free consultation.
Additional Reading
For more on Ionic debugging, check out this link from the Ionic team.