When you are building a cross-platform mobile app, being able to debugger that application is crucial to make sure you’ve built something that is robust and works well on all devices. When you’re using Ionic and Angular, that can be a little more effort than it is when you’re using IDEs like XCode, Visual Studio, and Android Studio.
In this blog, I want to show you how to debug an Ionic app built with Angular using Visual Studio Code and the Ionic extension. The process I will show you will help you identify and resolve coding issues and maintain a smooth user experience across various devices and platforms. It also gives you access to Visual Studio Code’s powerful debugging tools, making it easier to pinpoint and fix problems effectively.
For the examples in this blog, we are going to build an app that uses the PokéApi to get a list of 10 Pokémon to display.
How to Debug an Ionic App in the Browser
1. Put a debugger statement in line 30 (home.page.ts).

2. Run the command npm run start in the terminal.
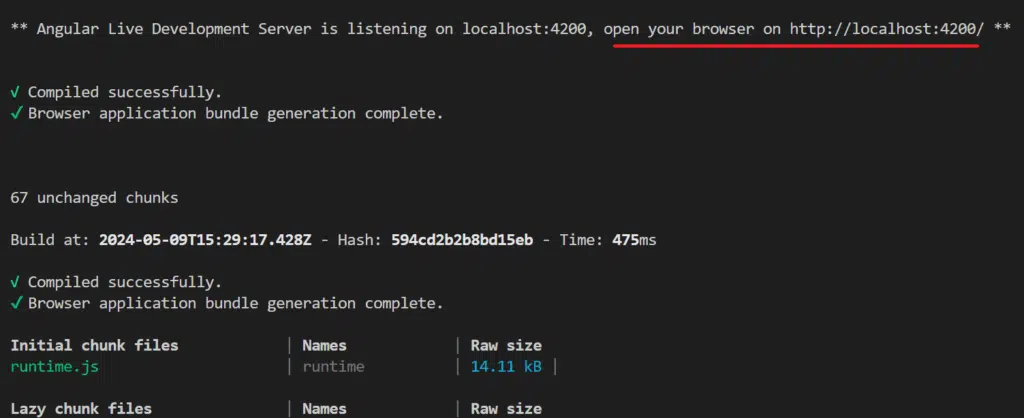
3. Open localhost:4200 in your browser (I recommend using Google Chrome).
4. Press F12 in the browser to open the Developer Tools, and select the option to display as a mobile device.
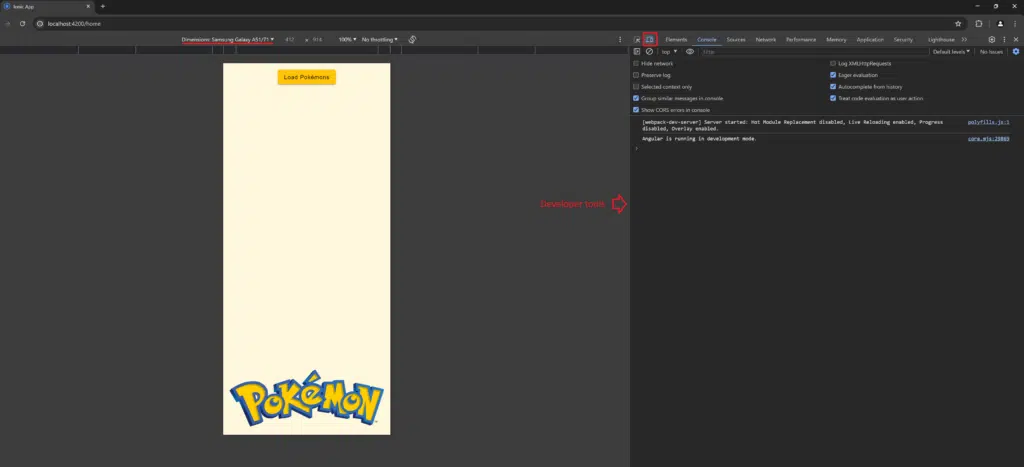
5. Click the Load Pokémons button.
The debugger tool is enabled when the browser detects the debugger in the line 30.

If we click the Step Over button, we can jump to the next line. Also, we can see in the Locals section of our debugger the result of calling the API at https://pokeapi.co/api/v2/pokemon?limit=10&offset=0.


Debug an Ionic App on Android Device (from Windows)
1. Enable Developer options on the phone and USB debugging.

2. Install the Ionic official extension in Visual Studio Code.

3. Run ionic build.
4. Run npx cap copy && npx cap sync && npx cap open android. (Reference link)
npx cap open android will open the project on Android Studio.

5. Run the app using Android Studio.
6. Return to Visual Studio Code and Select the Ionic extension.
7. Select Debug > [app name].

8. Put a breakpoint in the line 30 (home.page.ts). Note that you don’t need to use the debugger statement when debugging this way.

9. Click the Load Pokémons button.
The breakpoint will be hit by the debugger, and one again we’ll see the result of calling the API at https://pokeapi.co/api/v2/pokemon?limit=10&offset=0.

Debug an Ionic App on iOS Device (from Mac)
1. Open the project in Visual Studio Code.
For the iOS version, the Ionic extension doesn’t allow us to debug in the same way as the Windows version on Android but the XCode can show the console.log.
2. Add console.log in the lines 29 and 41 (pokemon-detail.page.ts).


3. Run ionic build.
4. Run npx cap copy && npx cap sync && npx cap open ios. (Reference link)
npx cap open ios will open the project on XCode.
5. Select an available device or simulator and run the app using XCode.

To access the Pokemon-Detail page, tap any pokémon in the list (for instance, tap Charmander).

The console.log events will be shown in the XCode console:

While Xcode doesn’t allow setting breakpoints, you can use browser-based debugging instead. To initiate the app on a Mac, use the command sudo npm run start. Once the app is running, you can follow the steps described above in “How to Debug an Ionic App in the Browser.” Open the browser’s developer tools to set breakpoints, inspect elements, and monitor console logs. This approach leverages the powerful debugging features available in browsers, ensuring an efficient debugging process.
Conclusion
Debugging Ionic applications on both Android and iOS platforms introduces unique challenges due to the inherent differences in operating systems and hardware configurations. However, leveraging tools such as Visual Studio Code and its Ionic extension along with Android Studio, Chrome DevTools, and Xcode can significantly streamline the debugging process.
Despite the complexity, the evolving tools and debugging practices outlined above can help developers mitigate these challenges, facilitating the easier debugging of cross-platform Ionic applications.
NOTE: All the code from the demos in this blog is available on Trailhead’s GitHub.