Slow SQL or incorrect or missing indexes can cause performance issues in an API. And those issues can be difficult to fix or even find. I use a variety of tools when investigating slow APIs, but if the API uses a SQL database I have a few that are invaluable in finding ways to improve performance.
If the API is using a common stack including Entity Framework Core and SQL Server, sometimes the suspected problem is the generated SQL. Maybe the queries themselves are inefficient, or maybe a statement is called multiple times by mistake. These may result in duplicated SQL or unnecessary database requests. If I want to view the SQL being executed by the API, I have several options.
Visual Studio Output
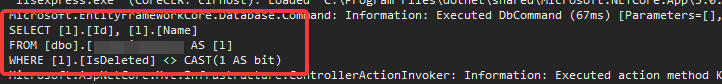
The latest versions of .NET Core make it pretty easy to output the SQL when debugging. You can set the logging level for Microsoft to “Information”. Then you can view the SQL in the output log when running in debug mode from Visual Studio.
"Logging": {
  "LogLevel": {
    "Default": "Debug",
    "System": "Information",
    "Microsoft": "Information"
  }
}
The SQL will then be visible in the Output panel.
MiniProfiler
But my personal favorite way to view the SQL from my API is to use MiniProfiler to set up some basic SQL profiling. Setting up MiniProfiler using memory cache and showing SQL for EntityFrameworkCore API requests is very straightforward. You will need the Miniprofiler.EntityFrameworkCore NuGet package. You will also need to add some simple configuration to the ConfigureServices method.
public void ConfigureServices(IServiceCollection services)
{
    services.AddMiniProfiler(
      options =>
        {
          // (Optional) Path to use for profiler URLs, default is /mini-profiler-resources
          options.RouteBasePath = "/profiler";
          (options.Storage as MemoryCacheStorage).CacheDuration = TimeSpan.FromMinutes(60);
          // (Optional) Control which SQL formatter to use, InlineFormatter is the default
          options.SqlFormatter = new StackExchange.Profiling.SqlFormatters.InlineFormatter();
        }).AddEntityFramework();
}
And adding UseMiniProfiler() to the Configure method.
public void Configure(IApplicationBuilder app, IWebHostEnvironment env)
{
     if (env.IsDevelopment())
     {
          app.UseMiniProfiler();
      }
…
Now you are ready to debug and view MiniProfiler output of the SQL. To test it, run your API in Debug mode and make a few requests. Then navigate to your API profiler results at [your-api-url]/profiler/results-index.
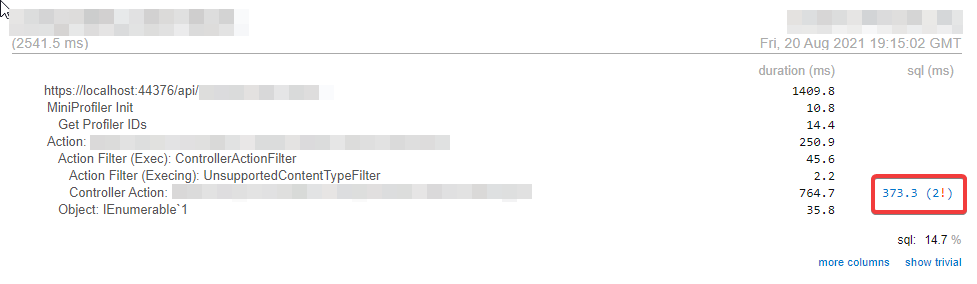
You will see a list of those requests made, and each row can be clicked to view details on that request.

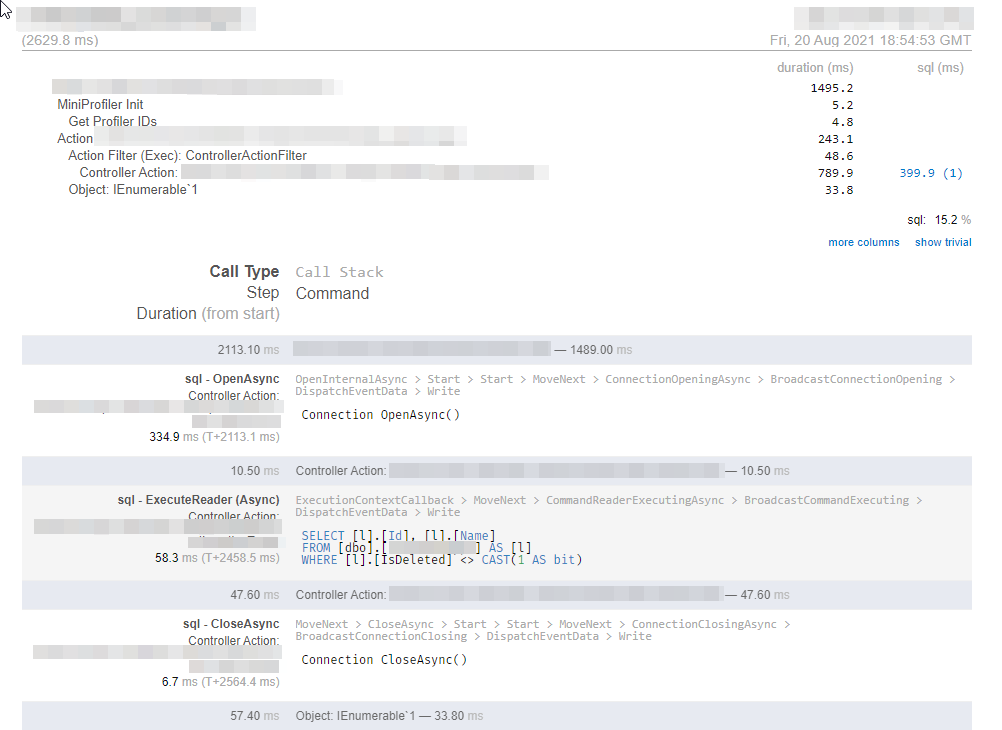
Clicking one of these rows will show details about the request. If there are SQL statements executed, you will be able to see the SQL exactly as it was executed, along with the timing of the request.
If your request happens to result in identical SQL statements, MiniProfiler will show a warning that these are duplicated statements. This is a good clue if you are looking for reasons why a particular request is slower than expected.
And from this point, you can also tune performance on the SQL statements or related indexes using Sql Server Management Studio, or one of my favorite tools, SentryOne Plan Explorer. Good luck and happy coding!


