Basics
JMeter is an open-source software application that can be used for both performance and load testing.
Performance testing focuses on how a system performs overall under a given configuration. It gives you diagnostic information which can help you eliminate issues in the tested app.
Load testing is a specific type of performance testing and is all about modeling the expected usage of the app by simulating multiple users accessing it concurrently.
JMeter is a very simple, straightforward tool that can be used for both of these types of testing. It’s important to emphasize from the beginning that JMeter doesn’t replace Postman or other similar apps for API testing, but it’s definitely one of the best available tools for performance testing.
Here are a couple of details about JMeter you should know before we go into a sample project setup:
- Freely available
- Simple GUI
- Platform-independent tool
- Highly extensible
- Working with different protocol types (HTTP , HTTPS, FTP, LDAP, SOAP etc…)
Project Setup
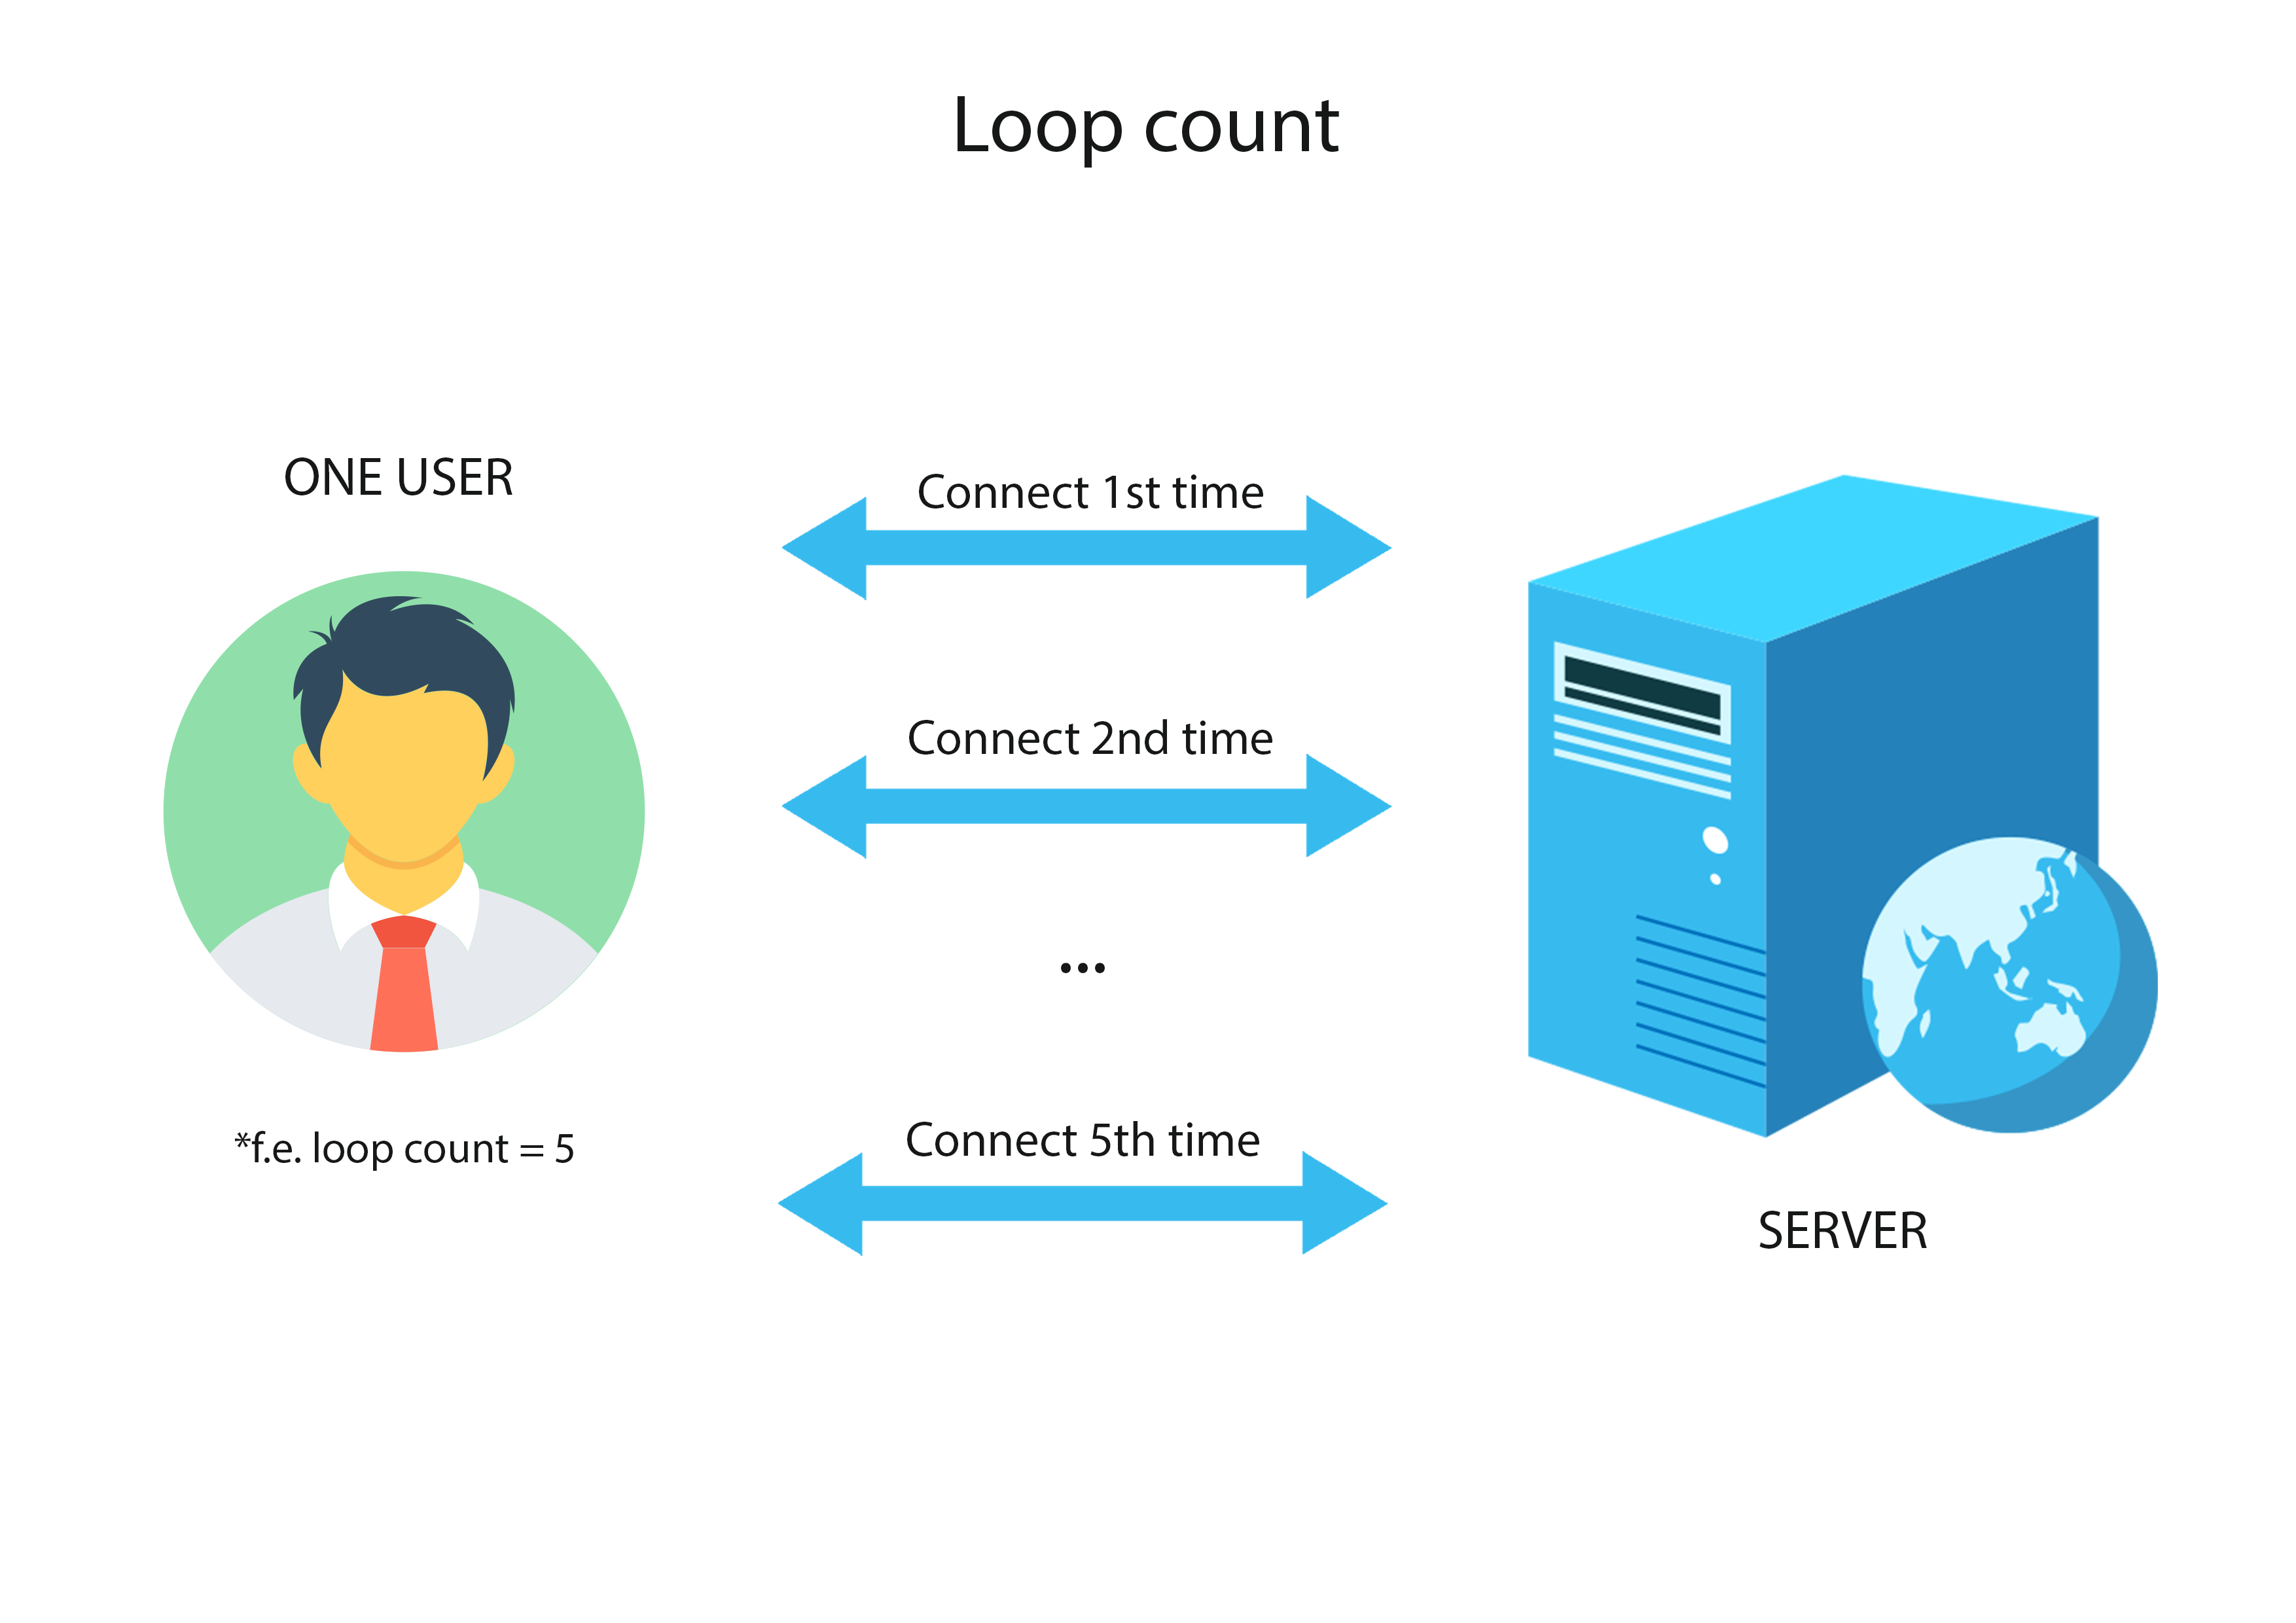
The main setup of a load test is done under something JMeter calls a Test Plan. A Test Plan, in turn, contains a “Thread Group”, or group of threads that will execute the same scenario. To create the thread group, you will need to set three parameters:
- Number of threads (users)
- Ramp-up period
- Loop count
Number of threads (users) – the number of concurrent users connected to the target website.

Ramp-up period – this parameter tells JMeter how long to delay before starting next user.

Loop count – number of times to execute the test.
With those settings in place, we’ve now configured our Thread Group, but we still need to set up the scenarios to be tested. Below are some tips and tricks for setting up some good test scenarios.
Tips and Tricks
1. Add request defaults
The first and the easiest thing which will save your time is specifying some default settings for your requests. After those are set, you will only need to specify the ones that differ for each added request.
Add → Config Element → HTTP Request Defaults
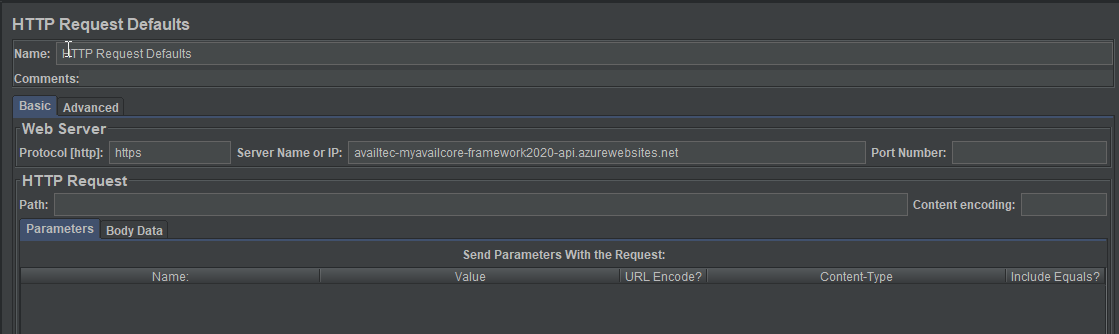
Image 4. HTTP Request Defaults configuration
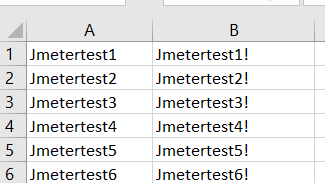
2. Add CSV data set config
Obviously, we want to test our web app, so we are interested in unique users concurrently sending requests, not just a single user going through the login process and sending requests. To set up your tests to run with multiple users, you can use a data file following the steps below.
Add → Config Element → CSV data set config
Then we need to fill in at least three values (see the image below):
– Filename: if your data file is in the /bin directory, this can just be the filename. If it’s somewhere else, use the full path to the file.
– Variable names: this is the equivalent to a «column name» in a spreadsheet.
– Delimiter: a comma is the default delimiter for a CSV file, but if your file uses tabs, this is the place to mention that.

Image 5. CSV Data Set Config configuration
This is how the CSV file looks with a combination of usernames and passwords, plus what your request will look like after setting it up.

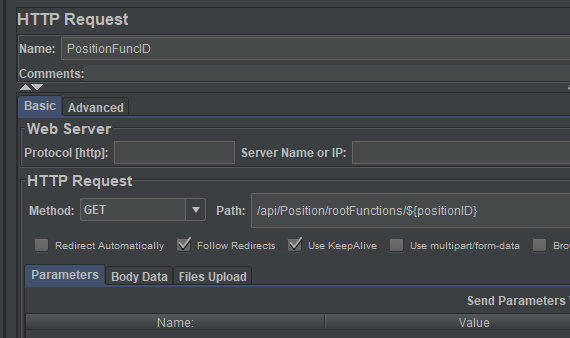
3. Token extraction
The next important step for building your project is the token extraction after login. Following requests (after the login is complete) will need to use a session token, so we need to extract that token value from the login response and work with it like a variable. Check the server response after logging in on browser and pay attention to token part, verify how the token is named and catch that expression using a JSON extractor after your login response through JMeter:
Add → Post Processors → JSON Extractor

When you have your token and save it as a variable, you can then use it in any following request headers, as shown in the image below.

4. User-defined variables
Now imagine that we are working with hundreds of requests through JMeter and some of them have dynamic parts of the URL, some have different values inside the POST bodies, etc. If we need to change something in 1 or 2 requests – it’s fine, just manually change them, but what if we need to change the URL part in 30-300 similar requests? For this exact reason, JMeter recommends that we use a defined variable. Just add a name and value (and description if you need it) and then use them inside your requests as variables.
Add → Config Element → User defined variables

5. Response assertions
Finally, there’s a feature of JMeter that is often overlooked but is very useful and highly recommended by me. We can verify almost everything needed after getting the response from the server through the Response Assertions element.
Add → Assertions → Response Assertion

As you can see on the image above, you can choose a lot of parameters to verify inside the response: text message, response code/message, etc. For example, if we want to verify the token before extraction, we can get a «token» stroke in response. We need to add an Assertion like on the screenshot below and also add an Assertion Result by going to Add → Listener → Assertion Results. If after running the test everything passed the assertions – we will just get a list of responses without error messages.


For example, you can try to verify «noelement» stroke inside the response and check the results.

Analyzing Results
For the result analysis, the most commonly used listeners are:
Add → Assertions → View Results Tree
Add → Assertions → Aggregate Report
View Results Tree helps you to verify the response statuses, analyze the request headers and body, response body, etc.
The Aggregate Report gives you all your statistical information, like the average response time, min and max time for different requests, etc. It’s a good practice to transfer all the needed data in Excel or Word docyment after getting the results from JMeter so you can create some comparison tables or diagrams. For example, on one of my projects we refactoring some code, and after it was complete, JMeter detected that some requests were taking too much time to respond. Running JMeter before and after the refactoring showed a very different result inside the Aggregate Report. By copying all key metrics to an Excel file, I was easily able to compare the before and after results.


Besides what I’ve shown you, JMeter also supports dashboard report generation. More detailed info about this feature can be found on the official Apache JMeter website here: https://jmeter.apache.org/usermanual/generating-dashboard.html
Hopefully, now I’ve shown you enough of the main JMeter features that you can start using it on your own projects.
As I said at the beginning – JMeter is a highly extensible app and it gives you the ability to make each of your projects better and better, as we have been able to do at Trailhead.
Thanks for your time, and have fun with JMeter!