Introduction
In this blog post, I will try to briefly condense my understanding of the work of Simon Brown, the creator of the C4 Model, a set of hierarchical diagrams that you can use to describe your software architecture.
I will talk about the current state of architectural visualization, the issues presented by them, and a suggested solution using the C4 Model.
The Current State of Software Architecture Visualization
Software architecture diagrams are a fantastic tool to communicate how we are planning to build a software system or how an existing software system works. However, in recent years, the creation of software diagrams has been scaled back as a result of the shift to agile methodologies.
Other documentation is often hard to understand because we don’t have a shared language. Usually, issues will be easier to identify in an architectural diagram because of their level of abstraction.
Don’t interpret agile methodology encouraging the omission of a big up-front design process to mean that there is no need for any up-front design. If you take it that far, you’ll be missing out and won’t have anything to visualize your system.
The C4 Model
C4 stands for context, containers, components, and code. These represent a set of four hierarchical diagrams which describe your software architecture at different levels of abstraction and are useful for different audiences. The C4 Model considers the people who use the software systems, the static structure in terms of containers (applications, data stores, microservices, etc.), its components, and the code. Let’s look at each of these in more detail.

Level 1 – Context
At this level of abstraction, you will see the software system you are creating and how people or other software systems interact with it. As you can see in the example below, these diagrams are very similar to a user story.

Level 2 – Container
This level of abstraction shows the parts that implement your software system. Every deployable part is called a “container”. Note that this terminology is not related to any specific containerization technology such as Docker.
This diagram is useful to record our technology decisions. In the following example, you can see the system inside the dashed box composed of five different containers, and which technologies are used for each.

Level 3 – Component
The Component diagram shows the components inside each individual container. These components should map to the abstractions in your codebase. In the next diagram, you can see a sample component diagram detailing the components in the API container.

Level 4 – Code
Finally, if you need it, you can zoom in to an individual component to show how it will be implemented. For this purpose, you would use a class diagram, the lowest level of abstraction. Usually, you wouldn’t create this by hand because you can often generate them automatically from most IDEs.
Notation
You can use any notation for your diagrams (even UML), but it is recommended that every element includes the name, type, technology (if appropriate), and a description. You should also include a diagram title to describe the type of diagram and its scope. Providing all of this text helps to remove ambiguity, ideally.
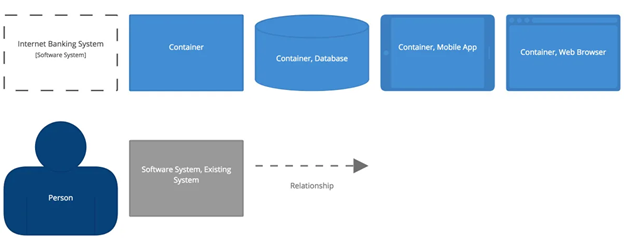
Whatever you use, your notation should be consistent across each level of detail. A key or legend should be part of your diagrams, explaining the shapes, styles, and colors used.
The following image is an example of a key or legend for the previous example.
Resources and Additional Information
I hope this brief introduction was a useful one. You can see more information in the following links. I especially recommend the books.
Stay tuned for a future blog post where I will show you some of the free tooling available to implement the C4 model.